History
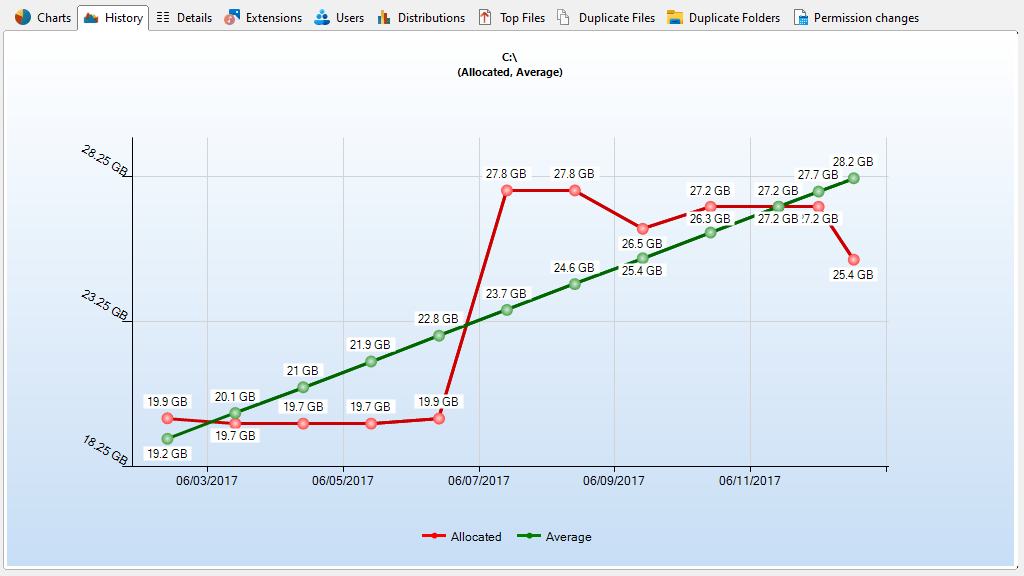
In the History view you can see line charts visualizing the size development of the selected root folder
You can customize the period of time shown here by usingthe option “Select history interval” on the History context tab. It is possible to choose a date before the first scan time and after the last scan time. If you do so the sizes used in the line charts for dates before the first scan time are values approximated by the creation time of the files. All values after the last scan time are projected values, based on the former scans. Please note that these values do not reflect the real space usage values!
Context tab: History
Use the “History” tab to customize the appearance of the chart, to export the chart to a file, and to manage history data.
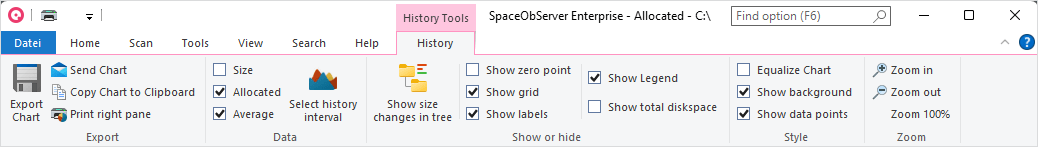
The following commands are available on the “History” tab:
Export Chart Saves the current chart as a graphic file.
Send Chart Exports the current chart and send it via email. You can configure your email settings in options dialog.
Copy Chart to Clipboard Copies the current chart to the clipboard (can be pasted in other applications).
Print right pane Prints the current chart.
Size Shows the historic growth of the size or number of files depending on the current View.
Allocated Shows the historic growth of the allocated size of the files.
Average Shows the avarage growth development of the files.
Select history interval Determines the currently shown history interval.
Show size changes in tree Shows the size changes of the currently selected history interval in the directory tree.
Note
The displayed size changes depend on the selected history interval.
Show zero point Shows the zero point as minimum value in the chart.
Show labels Shows short information for all segments of the chart.
Show grid Shows grid lines for this chart.
Show total diskspace Shows a horizontal line showing the total diskspace.
Equalize chart Toggles if the chart is displayed interpolated or exact.
Show background Toggles the gradient in the background of the chart.
Show data points Toggles datapoints displayed on the chart.
Zoom in Zooms in on the chart.
Zoom out Zooms out of the chart.
Zoom 100% Resets the zoom level to default.