Charts
This section contains options that change the amount of information that is shown in the chart related views of TreeSize and the way that they are displayed.
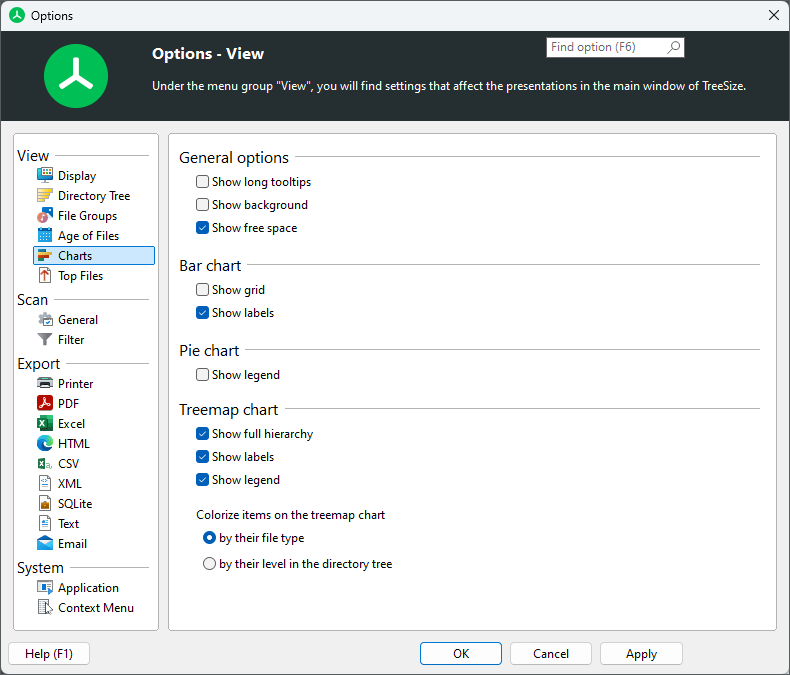
General Options
Show long tooltips
Activate this option to include additional tooltip information to the charts about the data that is currently being displayed.
Show background
Adds a color gradient to the background of the charts tab.
Show legend
Provides a description of the different segments that are included in a chart. The legend is shown below the chart.
Show free space
Includes a separate segment to the chart that indicates the amount of free space that is available on the drive that is currently being displayed.
Bar chart
Show grid
Adds a grid to the chart that corresponds to the current segmentation on the x-axis on the chart.
Show labels
Additional labels for each segment that contain name and size information.
Pie chart
“Show legend” provides a description of the different segments that are included in a chart. The legend is shown below the chart.
Treemap Chart
Show full hierarchy
If activated, TreeSize will show the full directory structure when displaying the treemap chart. If deactivated, it will only show the deepest nesting of the hierarchy, which means that only files and folders without subfolders will be shown.
Show labels
These labels describe which file, or folder is currently being displayed in the different tiles of the treemap chart.
Show legend
Provides a description of the different segments that are included in a chart.
Colorize items of the treemap chart
This option allows to change how items are colorized in the treemap chart. You can either select to use different colors for different file types, or to highlight the level of a file within the file system with a corresponding color.